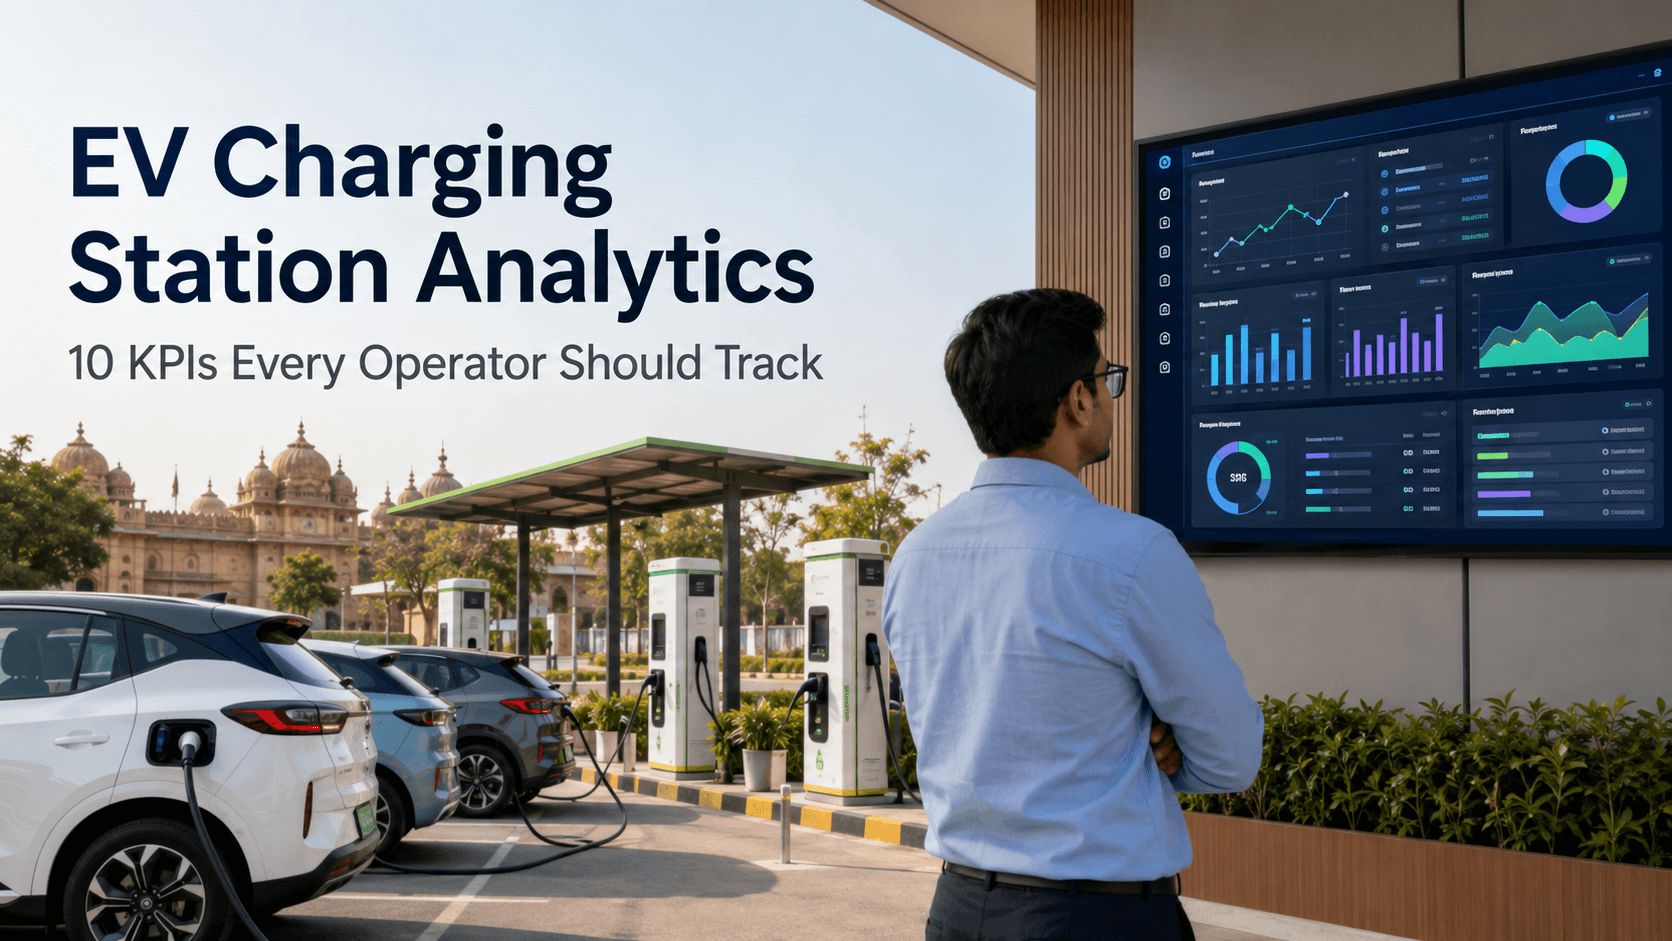
Installing an EV charging station is only the beginning of building a successful charging business.
After installation, operators must understand whether their chargers are reliable, how frequently customers use them, how much electricity is delivered and whether the station generates enough revenue to cover its operating costs.
A charging station may appear busy but still perform poorly because of:
- Low charger uptime
- Failed charging sessions
- High electricity costs
- Excessive peak electricity demand
- Poor customer retention
- Long maintenance delays
- Low revenue per charging bay
- Vehicles occupying bays after charging is complete
Without accurate operational data, these issues may remain unnoticed until they begin affecting revenue and customer trust.
This is why EV charging station analytics are essential.
A well-configured Charger Management System can collect information from networked chargers, while electricity meters, payment platforms, customer applications and maintenance records provide additional business data.
By combining this information, operators can understand how each charger, connector, charging bay and station is performing.
This guide explains 10 important EV charging station KPIs that operators, investors and franchisees should track to improve reliability, customer experience and profitability.
What Is an EV Charging Station KPI?
A Key Performance Indicator, or KPI, is a measurable value used to evaluate whether a charging station is achieving its operational or commercial objectives.
EV charging KPIs can help answer important questions, such as:
- Are the chargers available when customers need them?
- How many charging attempts are successful?
- How frequently is each charger used?
- How much electricity is delivered every day?
- Which chargers generate the highest revenue?
- How much does electricity cost per charging session?
- When does the station experience its highest demand?
- How many customers return?
- How quickly are charger faults repaired?
- Is every charging bay generating sufficient value?
A useful KPI should be:
- Clearly defined
- Measured consistently
- Connected to a business objective
- Reviewed regularly
- Compared across chargers and locations
- Used to support decisions
Collecting a large amount of data is not useful unless the operator understands what it means and takes action based on the findings.
The purpose of EV charging analytics is not simply to create reports. It is to help operators improve station reliability, reduce costs and make better investment decisions.
Data Sources Required for EV Charging Station Analytics
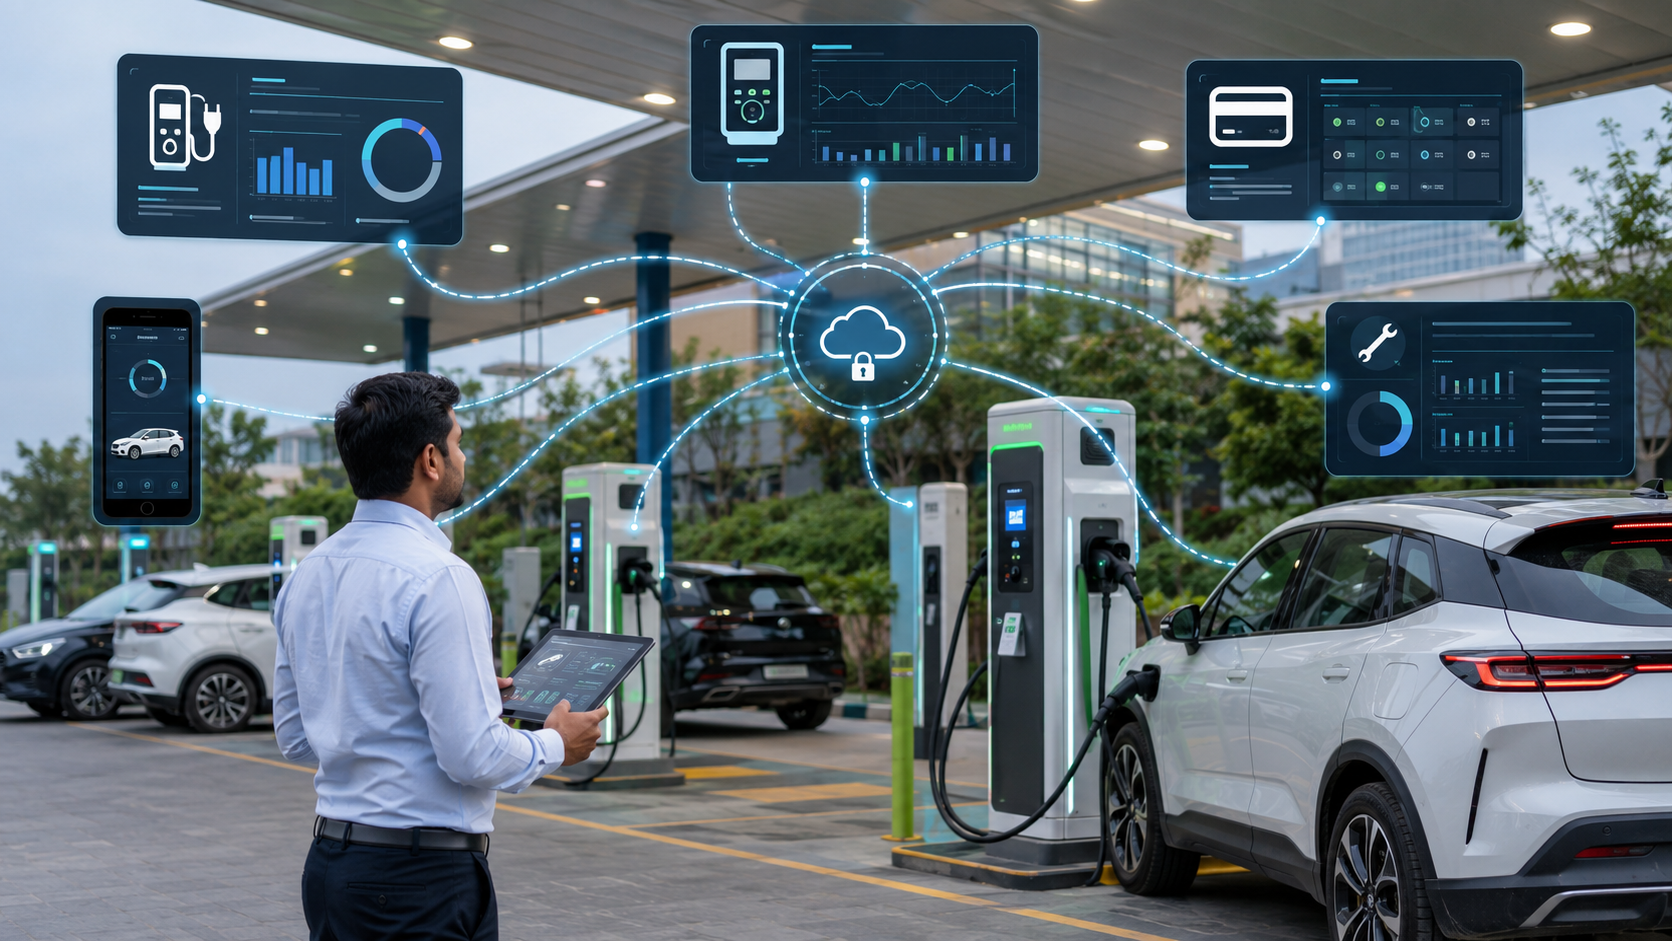
A complete analytics system may collect information from several sources.
Charger Management System
The Charger Management System may provide:
- Charger status
- Connector availability
- Charging session start and end times
- Energy delivered
- Charging power
- User authentication
- Fault codes
- Remote commands
- Charger communication status
- Firmware information
Electricity Meter
The electricity meter may provide:
- Total grid electricity consumed
- Maximum electricity demand
- Time-of-day consumption
- Transformer loading
- Auxiliary station consumption
- Solar electricity generation
- Battery storage activity
Payment System
The payment platform may provide:
- Charging revenue
- Successful payments
- Failed payments
- Refunds
- Discounts
- Payment method
- Fleet invoices
- Taxes and fees
Customer Application or CRM
A customer platform may provide:
- New customer registrations
- Repeat customers
- Charging frequency
- Customer complaints
- Support requests
- Promotions used
- Fleet account activity
- Customer feedback
Maintenance Records
Maintenance information may include:
- Fault reporting time
- Technician assignment time
- Site visit time
- Repair completion time
- Parts replaced
- Recurring faults
- Preventive maintenance activity
- Total charger downtime
Site Operations Records
The operator may also need information about:
- Charging bay occupancy
- Customer queue length
- Waiting time
- Staff availability
- Physical damage
- Internet interruptions
- Electricity outages
- Non-EV vehicles blocking charging bays
Understanding Chargers, Connectors and Charging Bays
Before calculating KPIs, operators should clearly define what is being measured.
Charger
The charger is the physical charging equipment or power cabinet.
Connector or Charging Port
A charger may have one or more connectors.
A dual-gun charger may have two connectors but may not always deliver its full rated power through both connectors simultaneously.
Charging Bay
The charging bay is the parking space used by an electric vehicle while charging.
One charger may serve:
- One charging bay
- Two adjacent charging bays
- Several bays through separate dispensers
Performance should ideally be measured at both the station level and connector level.
One connector may perform poorly even when the complete charger appears operational.
1. Charger Uptime

Charger uptime measures the percentage of scheduled operating time during which a charger or connector is online, functional and available to customers.
It is one of the most important EV charging station KPIs because a charger cannot generate revenue when customers cannot use it.
The basic formula is:
Charger uptime = Available operating time ÷ Scheduled operating time × 100
Suppose a charger should be available for 720 hours during a 30-day month.
If it remains unavailable for 18 hours:
Available operating time = 720 − 18 = 702 hours
Uptime = 702 ÷ 720 × 100 = 97.5%
What Should Count as Charger Downtime?
Downtime may include:
- Charger hardware failure
- Connector failure
- Communication failure
- Payment-system failure
- Emergency-stop activation
- Software malfunction
- Electrical isolation
- Scheduled maintenance
- Grid power outage
- Backend platform outage
- Damaged charging cable
Operators should record planned and unplanned downtime separately.
Planned Downtime
Planned downtime may include:
- Preventive maintenance
- Scheduled software updates
- Electrical inspection
- Equipment upgrades
- Transformer maintenance
Unplanned Downtime
Unplanned downtime may include:
- Power-module failure
- Damaged charging connector
- Unexpected payment failure
- Communication fault
- Software crash
- Grid interruption
Why Station-Level Uptime Can Be Misleading
Consider a station with four chargers.
Three chargers operate normally, while one charger remains unavailable for ten days.
The station may still appear online because the other chargers are working. However, one-quarter of the station’s charging capacity has been affected.
Operators should therefore calculate uptime for:
- Every connector
- Every charger
- Complete charging station
- Complete charging network
How to Improve Charger Uptime
Operators can improve uptime by:
- Monitoring chargers remotely
- Scheduling preventive maintenance
- Maintaining spare charging cables and connectors
- Tracking repeated fault codes
- Selecting vendors with local service support
- Defining technician response times
- Maintaining reliable internet connectivity
- Installing suitable surge and electrical protection
- Using modular charger designs
- Keeping critical spare parts available
2. Charging Session Success Rate
The charging session success rate measures how many valid charging attempts result in a successfully started and completed session.
A charger may appear online but still create a poor customer experience when:
- Authentication fails
- Payment fails
- The vehicle and charger cannot communicate
- Charging stops unexpectedly
- The connector does not lock correctly
- The mobile application cannot start the session
The basic formula is:
Charging session success rate = Successful charging sessions ÷ Valid charging attempts × 100
Suppose customers make 1,000 valid charging attempts during a month.
If 930 sessions start and complete successfully:
Session success rate = 930 ÷ 1,000 × 100 = 93%
What Is a Valid Charging Attempt?
An operator should create a consistent definition.
A valid charging attempt may begin when:
- A compatible vehicle is connected
- The customer starts authentication
- A payment request is submitted
- The charger is selected in the application
- An RFID card is tapped
The operator may exclude:
- Accidental application requests
- Incompatible connectors
- Technician testing
- Duplicate requests
- Sessions cancelled before authorisation
Common Types of Charging Session Failure
Authentication Failure
The charger does not recognise:
- RFID card
- Customer application account
- Fleet identifier
- QR-code request
Payment Failure
The session does not start because:
- Payment is declined
- Payment gateway is unavailable
- Customer balance is insufficient
- The wrong charger is selected
Communication Failure
The charger cannot communicate with:
- Electric vehicle
- Charger Management System
- Payment platform
- Energy Management System
Electrical Failure
Charging stops because of:
- Voltage variation
- Earthing fault
- Overtemperature
- Power-module failure
- Grid interruption
Customer-Related Failure
The session fails because:
- The connector is not inserted properly
- Vehicle charging is disabled
- The wrong charger is selected
- The battery is already full
Why Charging Session Success Rate Matters
Poor session success can damage customer trust even when charger uptime appears high.
A charger may display as available inside an application but fail when a customer tries to use it.
Operators should analyse success rates by:
- Charger
- Connector
- Vehicle model
- Payment method
- Software version
- Time of day
- Charging location
How to Improve the Session Success Rate
- Test chargers with commonly used EV models
- Simplify payment and authentication
- Provide clear customer instructions
- Monitor recurring fault codes
- Improve mobile and internet connectivity
- Update charger firmware
- Review failed payment patterns
- Train customer support staff
- Display a reliable support contact
- Generate alerts after repeated failures
3. Charger Utilisation Rate
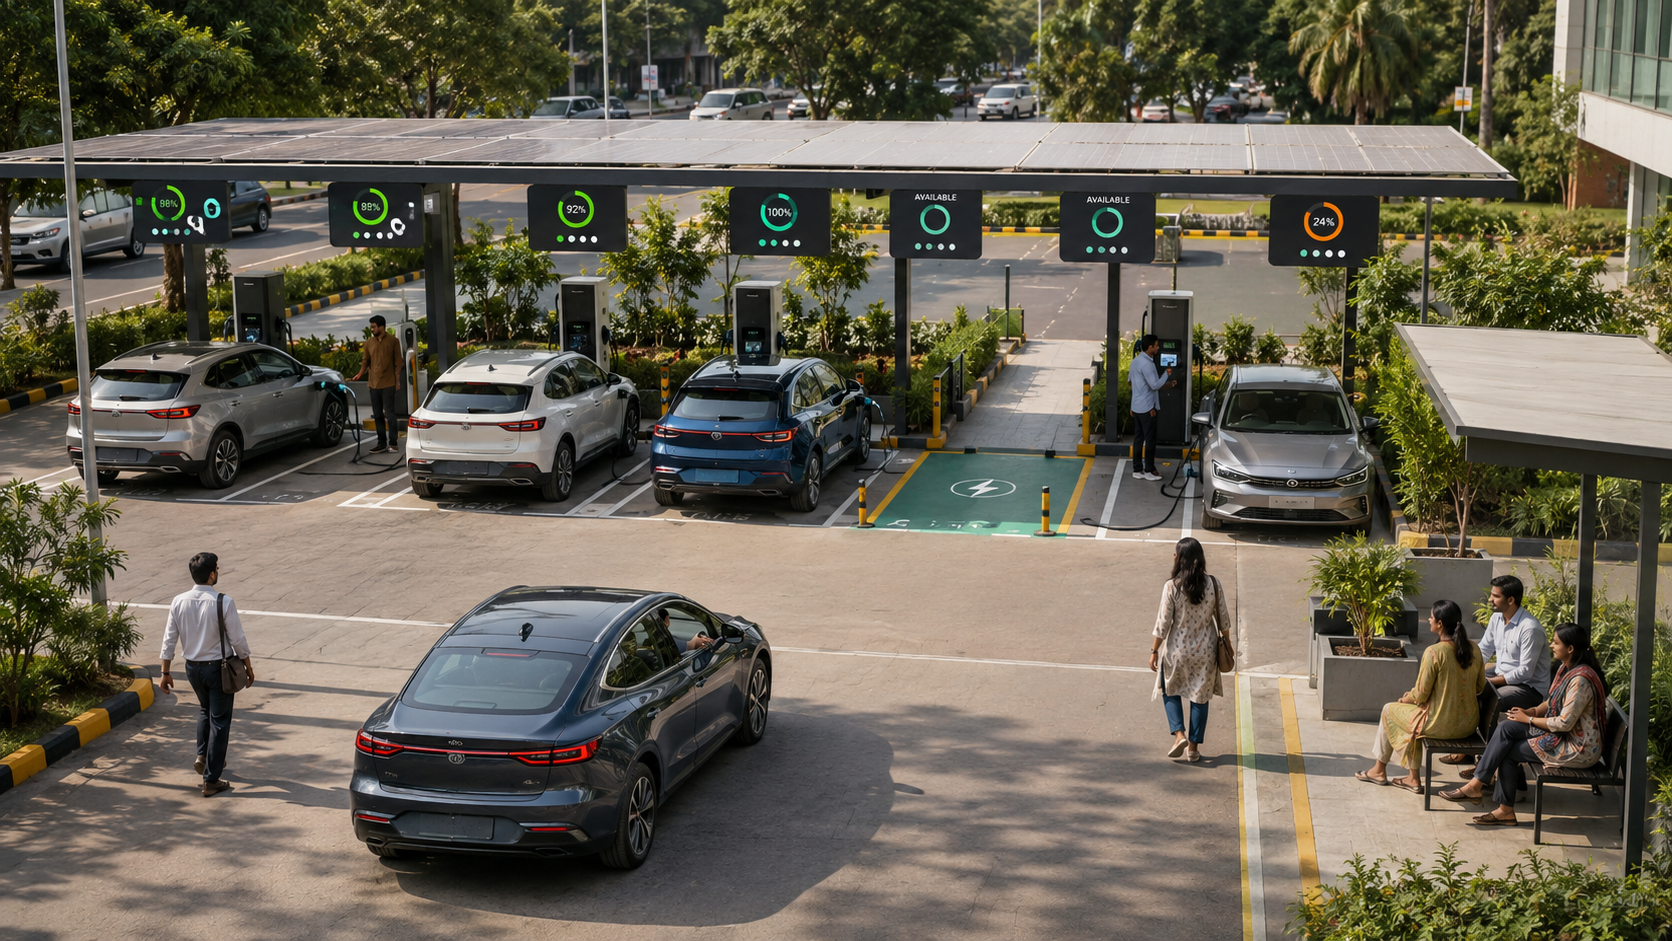
Charger utilisation measures how much of the charger’s available operating capacity is actually being used.
There are several ways to calculate utilisation.
Time-Based Utilisation
Time-based utilisation measures the percentage of available time during which a charger actively supplies electricity to a vehicle.
Time-based utilisation = Active charging time ÷ Available operating time × 100
Suppose a charger is available for 720 hours during a month and actively charges vehicles for 144 hours.
Utilisation = 144 ÷ 720 × 100 = 20%
Connector Utilisation
For chargers with multiple connectors, utilisation should be measured separately for each connector.
One connector may receive more use because of:
- Different connector standard
- Easier parking position
- Better cable reach
- Greater vehicle compatibility
- Customer preference
Energy-Based Utilisation
Energy-based utilisation compares actual electricity delivered with the theoretical maximum electricity the charger could have supplied.
Energy utilisation = Actual energy delivered ÷ Maximum theoretical energy × 100
Suppose a 60 kW charger is available for 720 hours.
Its theoretical maximum output would be:
60 kW × 720 hours = 43,200 kWh
If the charger delivers 8,640 kWh:
Energy utilisation = 8,640 ÷ 43,200 × 100 = 20%
This figure should be interpreted carefully because electric vehicles may not accept the charger’s maximum rated power throughout the complete session.
Why Charger Utilisation Matters
Very low utilisation may indicate:
- Poor charging station location
- Low local EV adoption
- Incorrect charger type
- Weak online visibility
- High charging price
- Frequent charger faults
- Inadequate customer facilities
Extremely high utilisation can also create problems, including:
- Customer queues
- Increased equipment wear
- Limited maintenance windows
- Lost customers during busy periods
- Need for additional chargers
How to Improve Charger Utilisation
- Add the station to maps and EV charging applications
- Partner with commercial fleets
- Improve station signage
- Introduce suitable off-peak pricing
- Partner with nearby hotels, offices or restaurants
- Improve charger reliability
- Match connectors with local vehicle demand
- Provide customer amenities
- Use local digital marketing
- Install additional chargers only when demand justifies expansion
4. Energy Delivered per Charger
This KPI measures the amount of electricity supplied to electric vehicles by each charger or connector.
It can be reported as:
- kWh per day
- kWh per week
- kWh per month
- kWh per charging session
- kWh per connector
- kWh per charging bay
The basic formula is:
Average energy per session = Total energy delivered ÷ Number of completed sessions
Suppose a station delivers 18,000 kWh through 900 completed charging sessions.
Average energy per session = 18,000 ÷ 900 = 20 kWh
Why Energy Delivered Is Important
The number of charging sessions alone can be misleading.
Consider two chargers:
- Charger A completes 300 sessions and delivers 3,000 kWh.
- Charger B completes 180 sessions and delivers 5,400 kWh.
Charger A serves more customers, but Charger B delivers more electricity.
This may happen because:
- Charger A serves scooters or short top-up sessions.
- Charger B serves larger electric cars or commercial fleets.
- Charger B offers higher charging power.
- Customers remain longer at Charger B.
Compare Similar Charger Types
A 7 kW AC charger should not be compared directly with a 120 kW DC charger without considering:
- Charger power
- Vehicle category
- Parking duration
- Operating hours
- Electricity cost
- Equipment investment
Operators should group similar charger types before comparing performance.
How to Use Energy-Delivery Data
Energy-delivery data can help operators:
- Forecast electricity purchases
- Plan transformer capacity
- Identify high-demand locations
- Measure charger growth
- Calculate charging revenue
- Schedule preventive maintenance
- Estimate expansion requirements
- Compare fleet and public customers
5. Revenue per Charger and Charging Bay
Revenue per charger measures the income generated by each charging asset.
The basic formula is:
Average revenue per charger = Total charging revenue ÷ Number of chargers
However, operators should also calculate revenue individually for every charger.
Revenue per Connector
For equipment with multiple charging connectors:
Revenue per connector = Revenue generated by that connector during the selected period
This can identify underperforming connector types.
Revenue per Charging Bay
Charging bays can occupy valuable parking space, especially at:
- Shopping malls
- Airports
- City centres
- Hotels
- Highway locations
The formula is:
Revenue per charging bay = Revenue associated with charging bays ÷ Number of bays
Revenue may include:
- Charging fees
- Parking fees
- Idle fees
- Fleet subscriptions
- Reservation fees
- Advertising revenue
- Property revenue share
Revenue per Available Hour
Another useful calculation is:
Revenue per available charger hour = Charger revenue ÷ Available operating hours
This allows operators to compare stations with different operating schedules.
Why Total Station Revenue Is Not Enough
Suppose a station earns ₹6 lakh per month.
The total may appear positive, but the station may contain ten chargers.
When two chargers generate most of the revenue and the remaining eight are rarely used, the investment may be inefficient.
Operators should review:
- Revenue per charger
- Revenue per connector
- Revenue per bay
- Revenue per session
- Revenue per kWh
- Revenue by customer type
- Revenue by time of day
How to Improve Revenue per Charger
- Improve charger uptime
- Increase utilisation
- Partner with commercial fleets
- Introduce appropriate pricing
- Reduce failed charging sessions
- Offer reservation services
- Promote lower-demand periods
- Install suitable chargers for each location
- Relocate persistently underused equipment where practical
6. Electricity Cost and Contribution Margin

Revenue alone does not show whether a charging station is profitable.
Operators must understand how much electricity and other variable costs are incurred for every unit of charging energy sold.
Electricity Cost per kWh Delivered
The formula is:
Electricity cost per kWh delivered = Total electricity cost ÷ Energy delivered to vehicles
Suppose the station’s electricity bill is ₹1,80,000 and it delivers 20,000 kWh.
Electricity cost per kWh delivered = ₹1,80,000 ÷ 20,000 = ₹9 per kWh
The effective cost may be higher than the basic electricity tariff because the bill may include:
- Energy charges
- Demand charges
- Fixed charges
- Taxes and duties
- Power-factor charges
- Transformer losses
- Station auxiliary consumption
- Battery storage losses
Electricity Cost per Charging Session
The formula is:
Electricity cost per session = Total electricity cost ÷ Number of completed charging sessions
This helps compare different customer and vehicle groups.
Contribution Margin per kWh
Contribution margin shows how much remains after the variable costs of selling one unit of charging energy.
Contribution margin per kWh = Charging revenue per kWh − Variable cost per kWh
Suppose:
- Charging revenue is ₹18 per kWh.
- Variable cost is ₹11 per kWh.
Contribution margin = ₹18 − ₹11 = ₹7 per kWh
This ₹7 is not the final profit.
It must still contribute towards:
- Property rent
- Employee salaries
- Maintenance
- Insurance
- Equipment financing
- Charger depreciation
- Software subscriptions
- Marketing
- Administration
Why Electricity Cost Can Change
The effective electricity cost may vary according to:
- Time of charging
- Maximum recorded demand
- Solar generation
- Battery storage usage
- Charger utilisation
- Applicable electricity tariff
- Distribution company
- State regulations
How to Improve Contribution Margin
- Schedule fleet charging during lower-cost periods
- Control station peak demand
- Use dynamic load management
- Improve solar energy utilisation
- Reduce payment failures
- Review property revenue-sharing terms
- Increase charger utilisation
- Reduce unnecessary auxiliary consumption
- Review customer pricing regularly
7. Average Charging Duration and Idle Time
Average charging duration measures how long vehicles actively receive electricity.
The formula is:
Average charging duration = Total active charging time ÷ Completed charging sessions
Suppose a station records 600 active charging hours across 1,200 completed sessions.
Average charging duration = 600 ÷ 1,200 = 0.5 hour
The average charging duration is 30 minutes.
Why Charging Duration Matters
Charging duration affects:
- Number of customers served
- Charger utilisation
- Customer queues
- Parking bay availability
- Customer experience
- Revenue per hour
The expected charging duration depends on:
- Charger capacity
- Vehicle battery size
- Initial battery state of charge
- Vehicle charging limit
- Battery temperature
- Customer charging requirement
Measure Connection Time Separately
A vehicle may remain connected after active charging has stopped.
Operators should separately measure:
- Active charging time
- Total connection time
- Post-charging idle time
- Complete charging bay occupancy time
Idle Time Formula
Idle time = Total connected time − Active charging time
Suppose a vehicle remains connected for 70 minutes but actively charges for only 45 minutes.
Idle time = 70 − 45 = 25 minutes
Why Excessive Idle Time Is a Problem
A fully charged vehicle occupying a charging bay can:
- Prevent another customer from charging
- Reduce station revenue
- Create customer queues
- Lower customer satisfaction
- Reduce effective charger utilisation
How to Reduce Idle Time
- Send charging-completion notifications
- Provide a reasonable grace period
- Apply transparent idle fees
- Display estimated completion time
- Provide separate waiting or parking areas
- Train fleet drivers
- Allow remote session monitoring
- Use charging bay sensors where appropriate
Idle fees should be communicated clearly and should not be charged when the charger itself prevents the vehicle from disconnecting.
8. Peak Demand and Load Factor
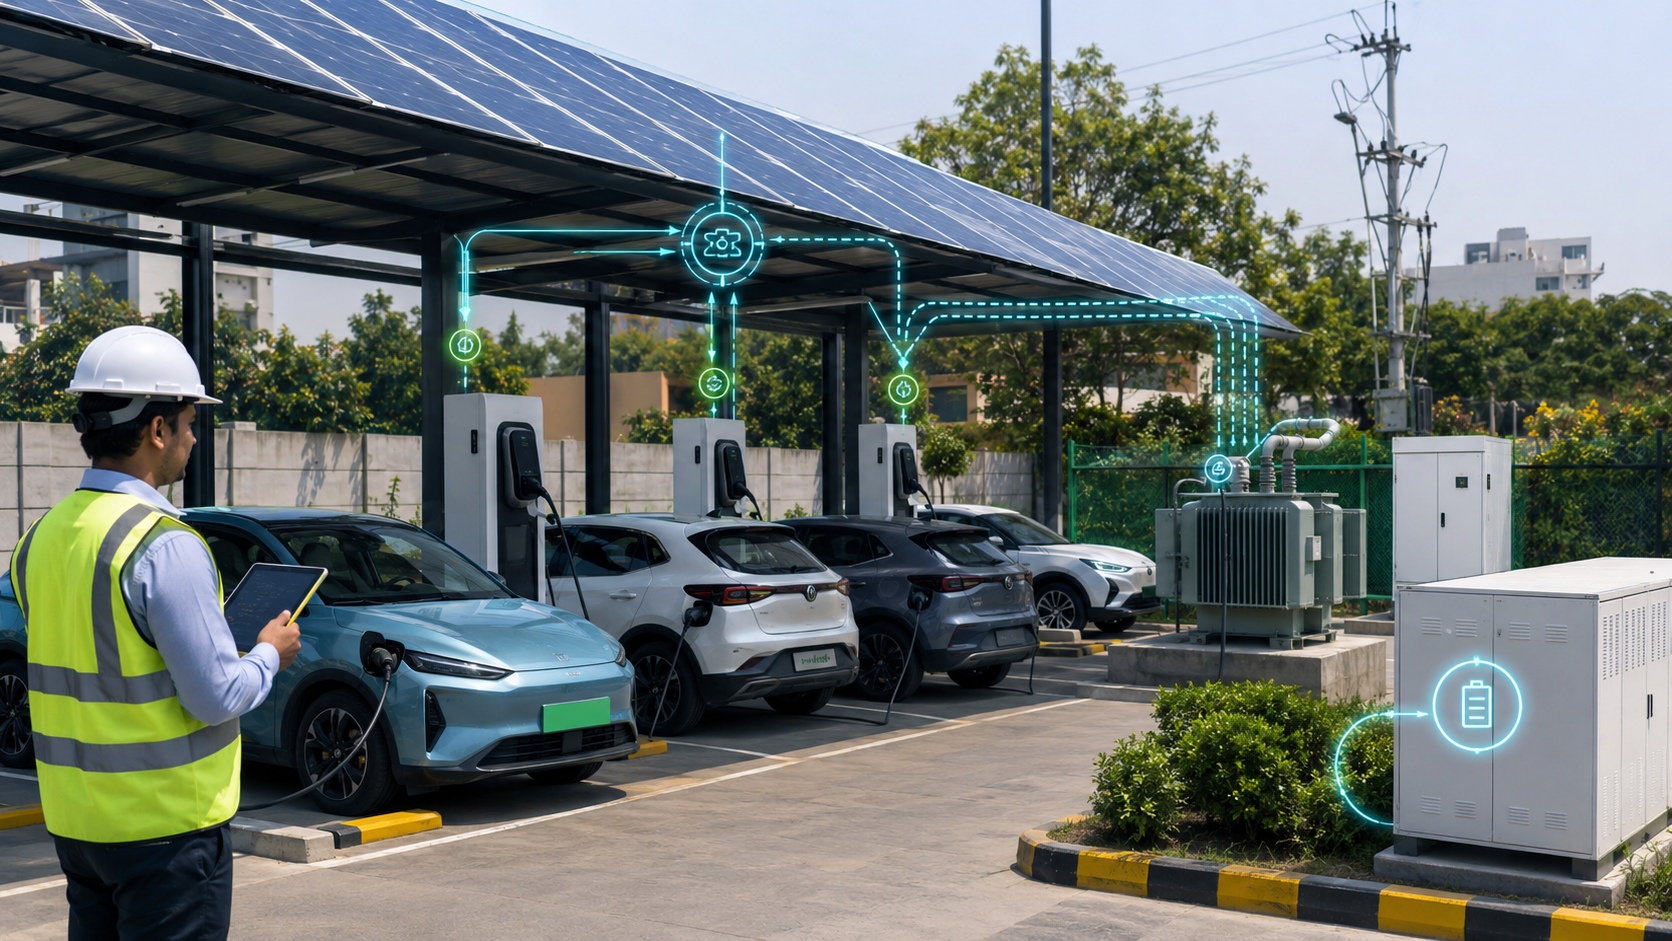
Peak demand measures the highest electricity load recorded by the charging station during a selected period.
This KPI is especially important for stations using:
- Multiple DC fast chargers
- High-power highway charging
- Fleet charging
- Electric bus charging
- Electric truck charging
- Commercial property electricity connections
Peak Demand
Suppose the station’s maximum recorded load during the month is 320 kW.
Its monthly peak demand is:
320 kW
This value may affect:
- Electricity demand charges
- Transformer requirements
- Sanctioned electricity load
- Grid upgrade decisions
- Battery storage sizing
Charging Station Load Factor
Load factor compares average electricity demand with peak demand.
The formula is:
Load factor = Average electrical load ÷ Peak electrical load × 100
Suppose a station delivers 72,000 kWh during a 30-day month.
The average demand would be:
72,000 kWh ÷ 720 hours = 100 kW
If the recorded peak demand is 400 kW:
Load factor = 100 ÷ 400 × 100 = 25%
A low load factor can indicate that the station experiences short, expensive electricity peaks but remains lightly used for much of the month.
Why Peak Demand Matters
Two stations can deliver the same amount of monthly electricity but create different infrastructure and operating costs.
Station A
- Energy delivered gradually
- Peak demand of 150 kW
Station B
- Energy delivered during short busy periods
- Peak demand of 400 kW
Station B may require a more expensive electricity connection and electrical infrastructure.
How to Control Peak Demand
- Use dynamic load management
- Share power between chargers
- Schedule fleet charging
- Introduce time-based pricing
- Coordinate charging with solar generation
- Use battery storage for short demand peaks
- Increase grid capacity only when justified
- Avoid starting all fleet chargers simultaneously
9. Repeat Customer Rate
Repeat customer rate measures the percentage of customers who return to use the charging station again.
The formula is:
Repeat customer rate = Returning customers ÷ Total unique customers × 100
Suppose a station serves 1,000 unique customers during a quarter.
If 420 customers use the station more than once:
Repeat customer rate = 420 ÷ 1,000 × 100 = 42%
Why Repeat Customers Matter
Returning customers can provide:
- More predictable revenue
- Lower marketing costs
- Greater station familiarity
- Faster authentication and payment
- Stronger fleet relationships
- More useful customer feedback
A low repeat customer rate may indicate:
- Poor charger reliability
- Difficult payment process
- High charging prices
- Unsafe or inconvenient location
- Lack of customer amenities
- Slow charging experience
- Poor customer support
- Stronger nearby competitors
Customer Retention by Segment
Repeat usage should be analysed separately for:
- Individual EV owners
- Taxi drivers
- Delivery fleets
- Hotel guests
- Employees
- Residential users
- Highway travellers
A highway station may naturally receive fewer frequent local customers than a neighbourhood fleet-charging location.
Additional Customer Metrics
Operators may also track:
- New customers per month
- Sessions per customer
- Energy delivered per customer
- Customer complaint rate
- Support response time
- Application rating
- Promotion redemption
- Fleet contract renewal
How to Improve Repeat Customer Rate
- Maintain strong charger uptime
- Simplify payment options
- Display transparent pricing
- Resolve customer complaints quickly
- Keep the station clean and safe
- Provide dependable lighting
- Offer useful amenities
- Maintain accurate map listings
- Provide fleet or loyalty programmes
- Avoid unnecessary application registration
10. Maintenance Response Time and Mean Time to Repair
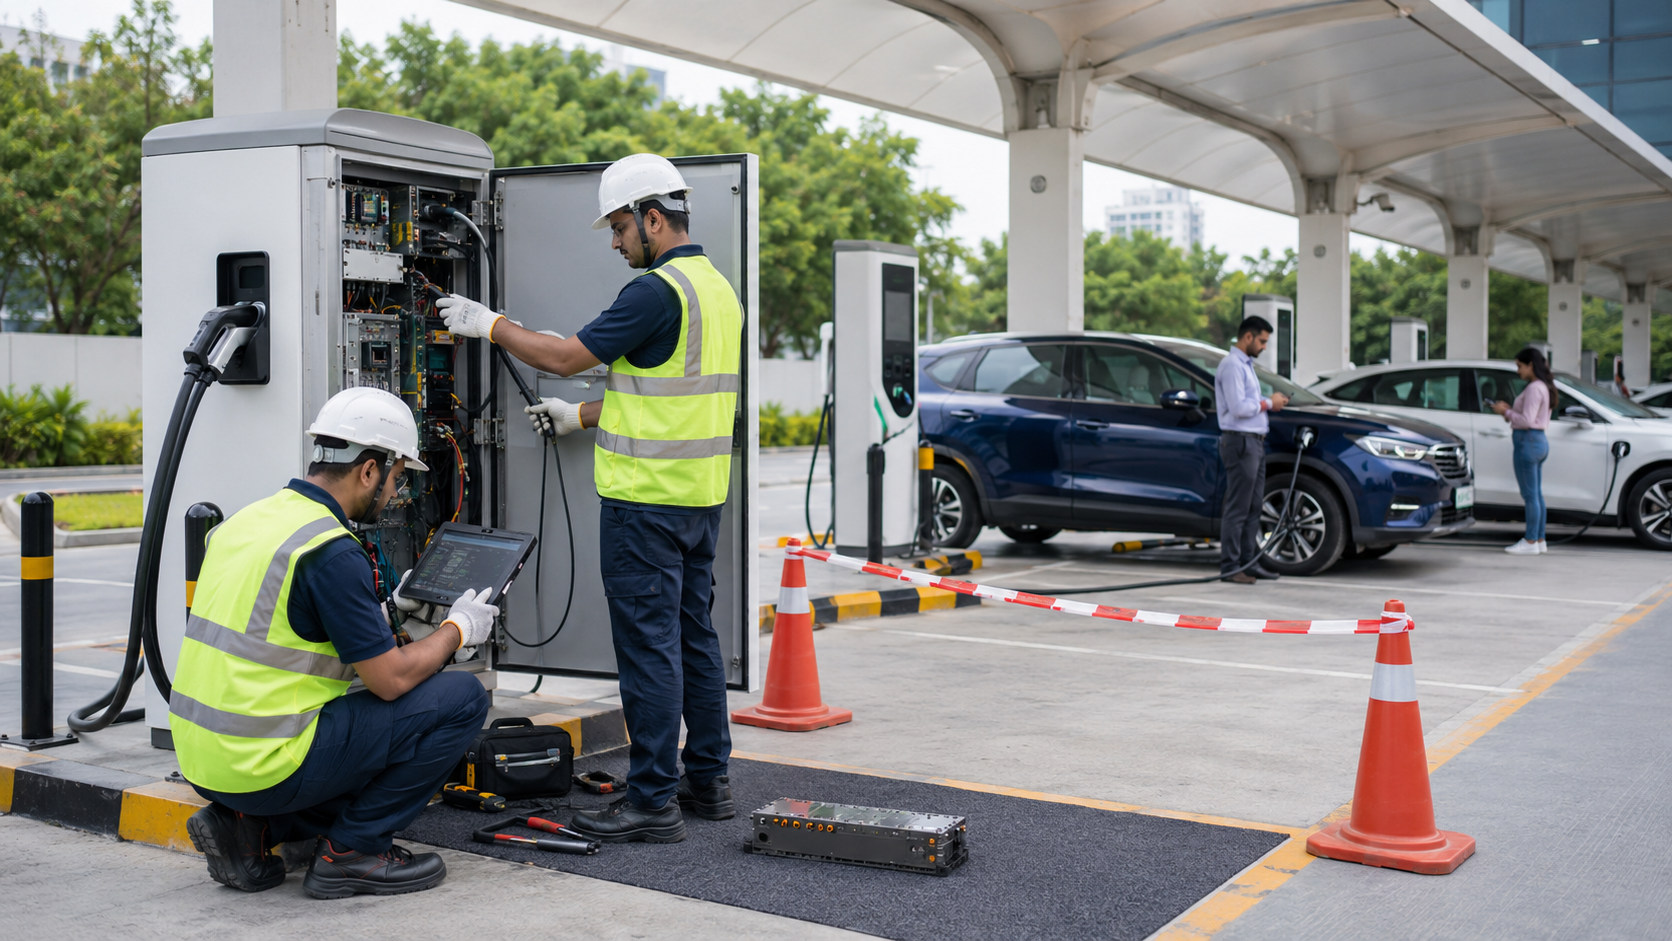
Maintenance response time measures how quickly the operator responds after a charger fault is detected.
The formula is:
Maintenance response time = Technician acknowledgement time − Fault detection time
Mean Time to Repair, or MTTR, measures the average time required to restore failed equipment.
The formula is:
MTTR = Total repair time ÷ Number of repaired incidents
Suppose five charger faults require a combined 25 hours to repair.
MTTR = 25 ÷ 5 = 5 hours
Measure the Complete Maintenance Timeline
Operators should record:
- Fault occurrence
- Automatic fault detection
- Staff acknowledgement
- Remote diagnosis
- Technician assignment
- Technician arrival
- Parts availability
- Repair completion
- Charger testing
- Return to service
This helps identify where delays occur.
Example
A charger may require only one hour of repair after the technician reaches the site.
However, the technician may wait two days for a replacement connector.
The main issue is therefore not the physical repair time. It is spare-parts availability.
Fault Categories to Track
- Charging cable damage
- Connector fault
- Power-module failure
- Display failure
- Communication failure
- Payment-system failure
- Cooling-system fault
- Metering fault
- Emergency-stop issue
- Electrical protection trip
- Software failure
- Physical damage
How to Reduce Mean Time to Repair
- Maintain a local service team
- Keep common spare parts available
- Use remote diagnostics
- Define vendor service-level agreements
- Track repeated faults
- Train station staff to perform basic checks
- Standardise charger models where practical
- Use modular charging equipment
- Maintain detailed maintenance records
- Automatically escalate critical failures
Monthly EV Charging KPI Dashboard
Operators should prepare a simple monthly performance dashboard.
| KPI | Current Month | Previous Month | Target | Status |
|---|---|---|---|---|
| Charger uptime | ||||
| Charging session success rate | ||||
| Charger utilisation rate | ||||
| Energy delivered | ||||
| Revenue per charger | ||||
| Contribution margin per kWh | ||||
| Average charging duration | ||||
| Peak electricity demand | ||||
| Repeat customer rate | ||||
| Mean Time to Repair |
The dashboard should show both the current value and the performance trend.
For example:
- Uptime may remain above target but decline for three consecutive months.
- Revenue may increase while contribution margin falls.
- Utilisation may grow while customer waiting time also increases.
- Energy delivered may increase because of one fleet contract rather than wider public demand.
Trends often provide more useful information than one isolated monthly value.
Illustrative Charging Station Performance Example
Consider a charging station with:
- Four 60 kW DC chargers
- Four charging bays
- 24-hour operation
- 30-day reporting period
- 1,200 completed sessions
- 24,000 kWh delivered
- ₹4,80,000 charging revenue
- ₹2,64,000 variable operating cost
- 600 active charging hours
- 80 charger faults requiring a combined 240 repair hours
Average Energy per Session
24,000 kWh ÷ 1,200 sessions = 20 kWh per session
Average Revenue per Session
₹4,80,000 ÷ 1,200 sessions = ₹400 per session
Revenue per kWh
₹4,80,000 ÷ 24,000 kWh = ₹20 per kWh
Variable Cost per kWh
₹2,64,000 ÷ 24,000 kWh = ₹11 per kWh
Contribution Margin per kWh
₹20 − ₹11 = ₹9 per kWh
Total Contribution Margin
₹4,80,000 − ₹2,64,000 = ₹2,16,000
This amount must still cover fixed expenses such as property rent, staff salaries, maintenance contracts, insurance and equipment financing.
Average Charging Duration
600 hours ÷ 1,200 sessions = 0.5 hour
The average charging duration is 30 minutes.
Average Revenue per Charger
₹4,80,000 ÷ 4 chargers = ₹1,20,000 per charger per month
Mean Time to Repair
240 repair hours ÷ 80 incidents = 3 hours
This example is illustrative. Actual charging station performance will vary according to charger capacity, location, vehicle type, electricity tariff and customer demand.
KPIs for Different Charging Station Types
Not every charging station should use the same performance targets.
Highway Fast-Charging Station
Important KPIs include:
- Charger uptime
- Charging session success rate
- Average charging duration
- Customer waiting time
- Peak electricity demand
- Revenue per charger
- Connector utilisation
Highway customers expect reliable and relatively fast charging.
Hotel or Resort Charging
Important KPIs include:
- Guest charging usage
- Energy delivered per stay
- Overnight charging bay occupancy
- Charger availability
- Charging-related property revenue
- Repeat guest usage
Charging may create value through hotel bookings rather than charging fees alone.
Shopping Mall Charging
Important KPIs include:
- Charging sessions per day
- Customer dwell time
- Post-charging idle time
- Revenue per parking bay
- Charging-linked retail visits
- Peak demand during mall operating hours
Residential Charging
Important KPIs include:
- Energy consumed per resident
- Successful scheduled sessions
- Evening peak demand
- Billing accuracy
- Charger availability
- Resident complaint rate
Fleet Charging Depot
Important KPIs include:
- Vehicles ready before departure
- Energy delivered per vehicle
- Energy consumed per kilometre
- Peak charging demand
- Charging cost per vehicle
- Missed charging sessions
- Charger uptime
- Maintenance response time
Electric Bus Depot
The most important performance indicator may not be revenue per charger.
It may be:
Percentage of scheduled buses ready at the required departure time
The KPI framework should always match the purpose of the charging station.
Daily, Weekly and Monthly KPI Reviews
Daily Monitoring
Review daily:
- Charger availability
- Active charger faults
- Failed charging sessions
- Payment failures
- Energy delivered
- Peak charging power
- Customer complaints
Daily reviews help resolve urgent operational issues.
Weekly Monitoring
Review weekly:
- Charger utilisation
- Charging revenue
- Electricity cost
- Repeated charger faults
- Technician performance
- Customer support cases
- Connector usage
Weekly reviews help identify developing trends.
Monthly Monitoring
Review monthly:
- Charger uptime
- Charging session success rate
- Contribution margin
- Revenue per charger
- Repeat customer rate
- Peak electricity demand
- Mean Time to Repair
- Location-level performance
- Expansion requirements
Quarterly Monitoring
Review quarterly:
- Charger vendor performance
- Pricing strategy
- Fleet contracts
- Charger relocation
- New charger investment
- Transformer or battery storage upgrades
- Software platform performance
- Customer retention
How to Compare Multiple Charging Locations
Operators managing several stations should not compare locations only by total revenue.
A large highway hub will naturally generate more revenue than a two-charger hotel site.
Useful comparison methods include:
- Revenue per charger
- Revenue per charging bay
- Energy delivered per connector
- Contribution margin per kWh
- Charger uptime
- Charging session success rate
- Charger utilisation
- Revenue per available hour
- Maintenance cost per charger
- Customer complaint rate
Charging locations should also be grouped by type:
- Highway charging stations
- Commercial properties
- Hotels
- Residential communities
- Fleet depots
- Public parking areas
- Transport hubs
This creates more meaningful comparisons.
How Analytics Supports Expansion Decisions
EV charging analytics can help determine whether to:
- Install additional chargers
- Increase charger capacity
- Add a different connector
- Upgrade the transformer
- Install battery energy storage
- Add solar energy
- Relocate a charger
- Sign a fleet-charging contract
- Change pricing
- Extend operating hours
Add More Chargers When:
- Utilisation remains consistently high
- Customers frequently experience queues
- Charging bay occupancy is high
- Sessions are lost during peak periods
- Existing chargers are reliable
- Local EV demand continues to increase
Avoid Immediate Expansion When:
- Existing chargers have low utilisation
- Charger uptime is poor
- Session success rates are low
- The site is difficult to access
- Charging prices are uncompetitive
- Available electrical capacity remains unused
Installing additional chargers will not solve weak demand or poor charger reliability.
Common EV Charging Analytics Mistakes
Tracking Only Total Revenue
Revenue does not reveal electricity costs, charger utilisation or actual profitability.
Measuring Only Station-Level Uptime
A complete station may appear online even when one charger or connector remains unavailable.
Counting Failed Sessions as Successful
A session that starts but stops after a few seconds should not automatically be classified as successful.
Ignoring Offline Charging Transactions
Chargers may temporarily store transaction data when internet connectivity is unavailable.
These transactions should be reconciled when the connection is restored.
Comparing Different Charger Types Directly
AC, moderate DC and ultra-fast DC chargers serve different customer requirements.
Ignoring Charging Bay Occupancy
A charger may appear available digitally but remain physically blocked by another vehicle.
Using Different KPI Definitions Across Locations
Every charging station should use consistent definitions for uptime, utilisation and successful charging sessions.
Ignoring Taxes and Revenue Sharing
Gross charging revenue is not the same as the income retained by the charging operator.
Focusing Only on Monthly Averages
A monthly average may hide severe evening, weekend or holiday congestion.
Failing to Act on Performance Data
Analytics reports provide little value when recurring faults and underperforming chargers remain unaddressed.
Questions to Ask a Charger Management System Provider
Before choosing an analytics platform, charging station operators should ask:
- Can data be viewed for every connector?
- How is charger uptime calculated?
- Can planned downtime be recorded separately?
- Are failed charging attempts captured?
- Can faults be grouped by category?
- Are charger meter values stored?
- Can revenue be compared with electricity delivered?
- Does the platform support OCPP?
- Can data be exported?
- Are customised dashboards available?
- Can electricity tariffs be configured?
- Can fleet and public users be separated?
- Are payment failures visible?
- Can maintenance tickets be integrated?
- Can automatic alerts be configured?
- How long is historical data retained?
- Can the platform integrate with solar and battery storage?
- Are staff permissions configurable?
- Are administrator activities recorded?
- Is the dashboard accessible on mobile devices?
Creating KPI Targets

There is no single KPI target suitable for every EV charging station.
Targets should consider:
- Charger type
- Operating hours
- Station location
- Vehicle category
- Customer expectations
- Electricity tariff
- Fleet commitments
- Maintenance support
- Stage of business growth
A newly launched station may initially focus on:
- Charger reliability
- Successful charging sessions
- Customer acquisition
- Online visibility
A mature charging network may focus more on:
- Contribution margin
- Customer retention
- Peak-demand control
- Revenue per charger
- Maintenance efficiency
KPI targets should be realistic while still encouraging continuous improvement.
Conclusion
EV charging station analytics help operators understand whether their charging infrastructure is reliable, frequently used and commercially sustainable.
The 10 essential EV charging station KPIs are:
- Charger uptime
- Charging session success rate
- Charger utilisation rate
- Energy delivered per charger
- Revenue per charger and charging bay
- Electricity cost and contribution margin
- Average charging duration and idle time
- Peak demand and load factor
- Repeat customer rate
- Maintenance response time and Mean Time to Repair
These KPIs should not be reviewed independently.
For example:
- High utilisation with low uptime can create customer queues.
- High revenue with high electricity costs may produce a weak contribution margin.
- High session volume with low repeat usage may indicate poor customer experience.
- Strong uptime with low utilisation may indicate an unsuitable location.
The strongest charging businesses combine technical, customer and financial data in one performance dashboard.
Planning or operating an EV charging station? Contact Earthtron EV to evaluate charger requirements, smart management systems and scalable charging infrastructure for your location.